2024 Presidential Nowcast
Forecasts & Predictions
Updated July 17, 2024 at 10:03 PM
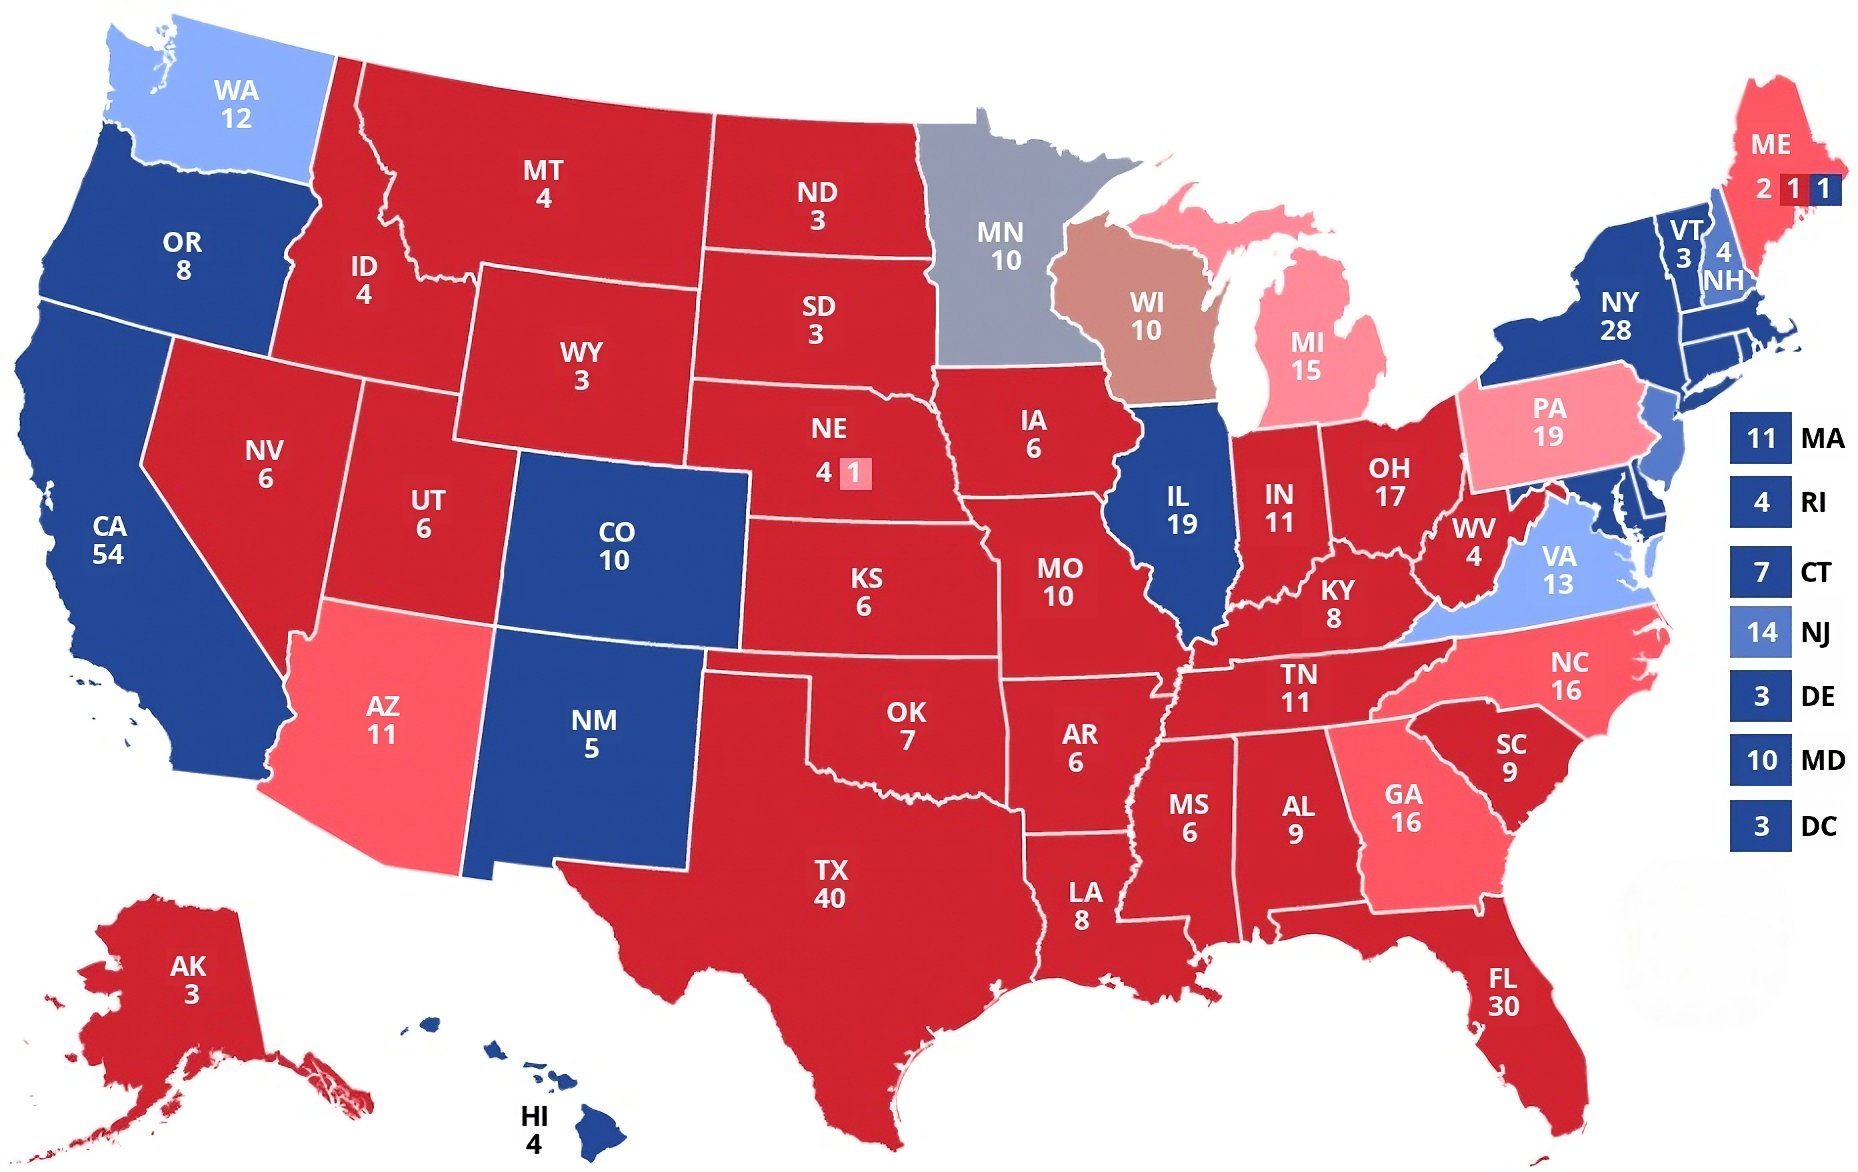
This is the 2024 HenryDRiley.com Polling Nowcast for the presidential race. It only uses the current polling averages at the state and national levels, and assumes that today is Election Day. It also doesn't add uncertainty for undecided/third party voters, and thus more aggressive and has less uncertainty, whereas my Forecast (coming soon) will include polls and fundamentals and have more uncertainty and less aggressiveness until Election Day.
Trump would be likely to win if the election were today.

Chance of winning
≥95%
≥80%
≥60%
≥50%
≥95%
≥80%
≥60%
≥50%
Chance of winning
The Electoral College is simulated 100,000 times using state nowcasts.
Biden
1 in 8
12% chance
Trump
7 in 8
88% chance
100 of 100,000 Simulations
Biden win
Trump win
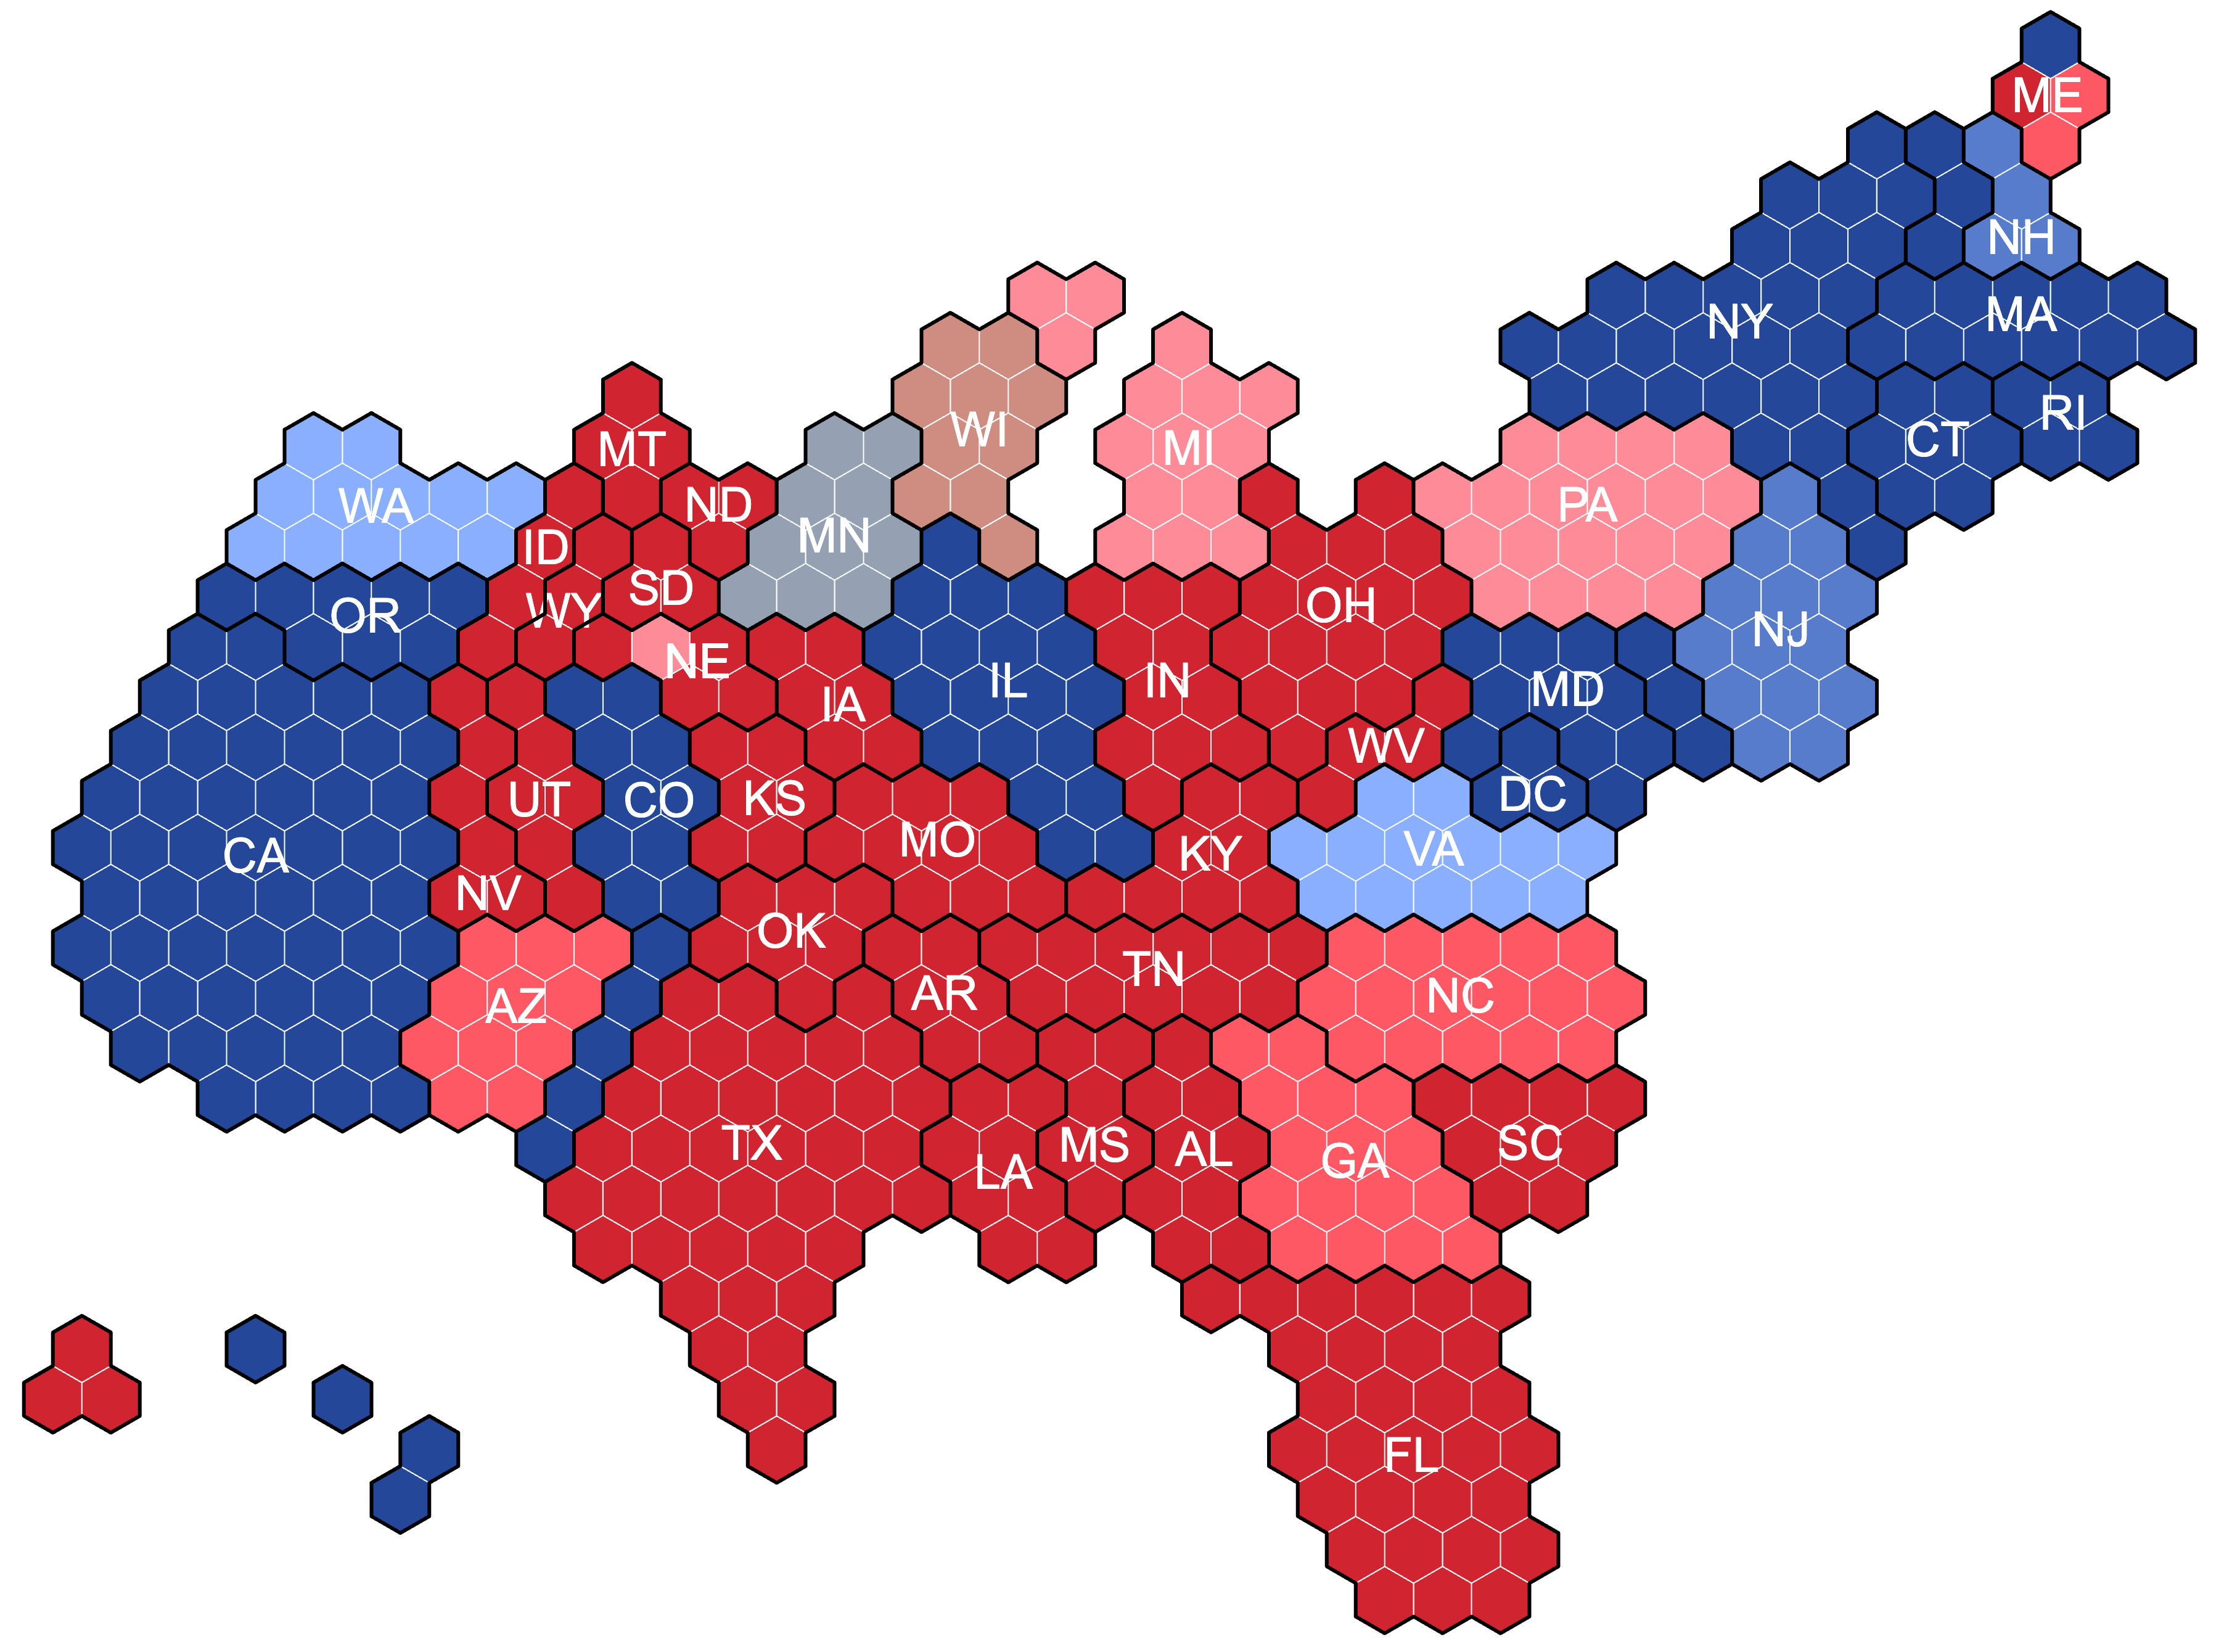
The Electoral College
Average electoral votes and the nowcast cartogram. Each hexagon represents one electoral vote.
Biden
233
Trump
305

Chance of winning
≥95%
≥80%
≥60%
≥50%
≥95%
≥80%
≥60%
≥50%
Estimated popular vote
State margins applied to ElectionPredictionsOfficial.com's turnout estimates, weighted with national polling.
Biden
47.2%
3rd Parties
4.5%
Trump
48.3%
The path to 270
Biden's safe states (by probability/margin) are on top, and Trump's are at the bottom. The highlighted state is the tipping point state, meaning whoever can secure all of the states from the top/bottom to the tipping point wins the election.
| State/District | Electoral Votes | Biden Voteshare | Trump Voteshare |
|---|---|---|---|
| D.C., VT, MA, MD, CA, DE, RI, NY, HI, CT, IL, OR, ME-1, NM, CO | 170 | ||
| New Jersey | 14 | 50.6% | 43.6% |
| New Hampshire | 4 | 51.8% | 45.5% |
| Virginia | 13 | 49.4% | 46.4% |
| Washington | 1 | 47.2% | 45.8% |
| Minnesota | 10 | 48.5% | 48.4% |
| Wisconsin | 10 | 46.4% | 47.6% |
| Michigan | 15 | 45.8% | 48.3% |
| Pennsylvania | 19 | 45.9% | 48.4% |
| Nebraska's 2nd District | 1 | 43.5% | 46.9% |
| Arizona | 11 | 44.0% | 49.5% |
| North Carolina | 16 | 44.2% | 50.3% |
| Georgia | 16 | 43.7% | 50.9% |
| Maine | 2 | 46.2% | 53.8% |
| NE-1, NV, TX, FL, OH, LA, KS, SC, IA, MO, MS, AL, AK, IN, MT, NE, TN, UT, ME-2, KY, SD, AR, ID, OK, WV, ND, NE-3, WY | 222 |
Tipping point
The state where both candidates are most likely to secure the 270 electoral votes for victory.
| State/District | Electoral Votes | Voteshare Margin | Chance | Rating |
|---|---|---|---|---|
| Arizona | 11 | 5.5% | 15% Biden - Trump 85% | Likely Trump |
How the Nowcast has changed
Chance of winning (%)
Avg. electoral votes
Est. two-party popular vote (%)
State nowcasts
Select a state/district
A range of possibilities
What's likely - and what's not - with both the electoral college and popular vote.
Chance of winning the popular vote
43%
57%
90% of simulations
285
253
to
179
359
Potential landslides
374
164
or
80
458
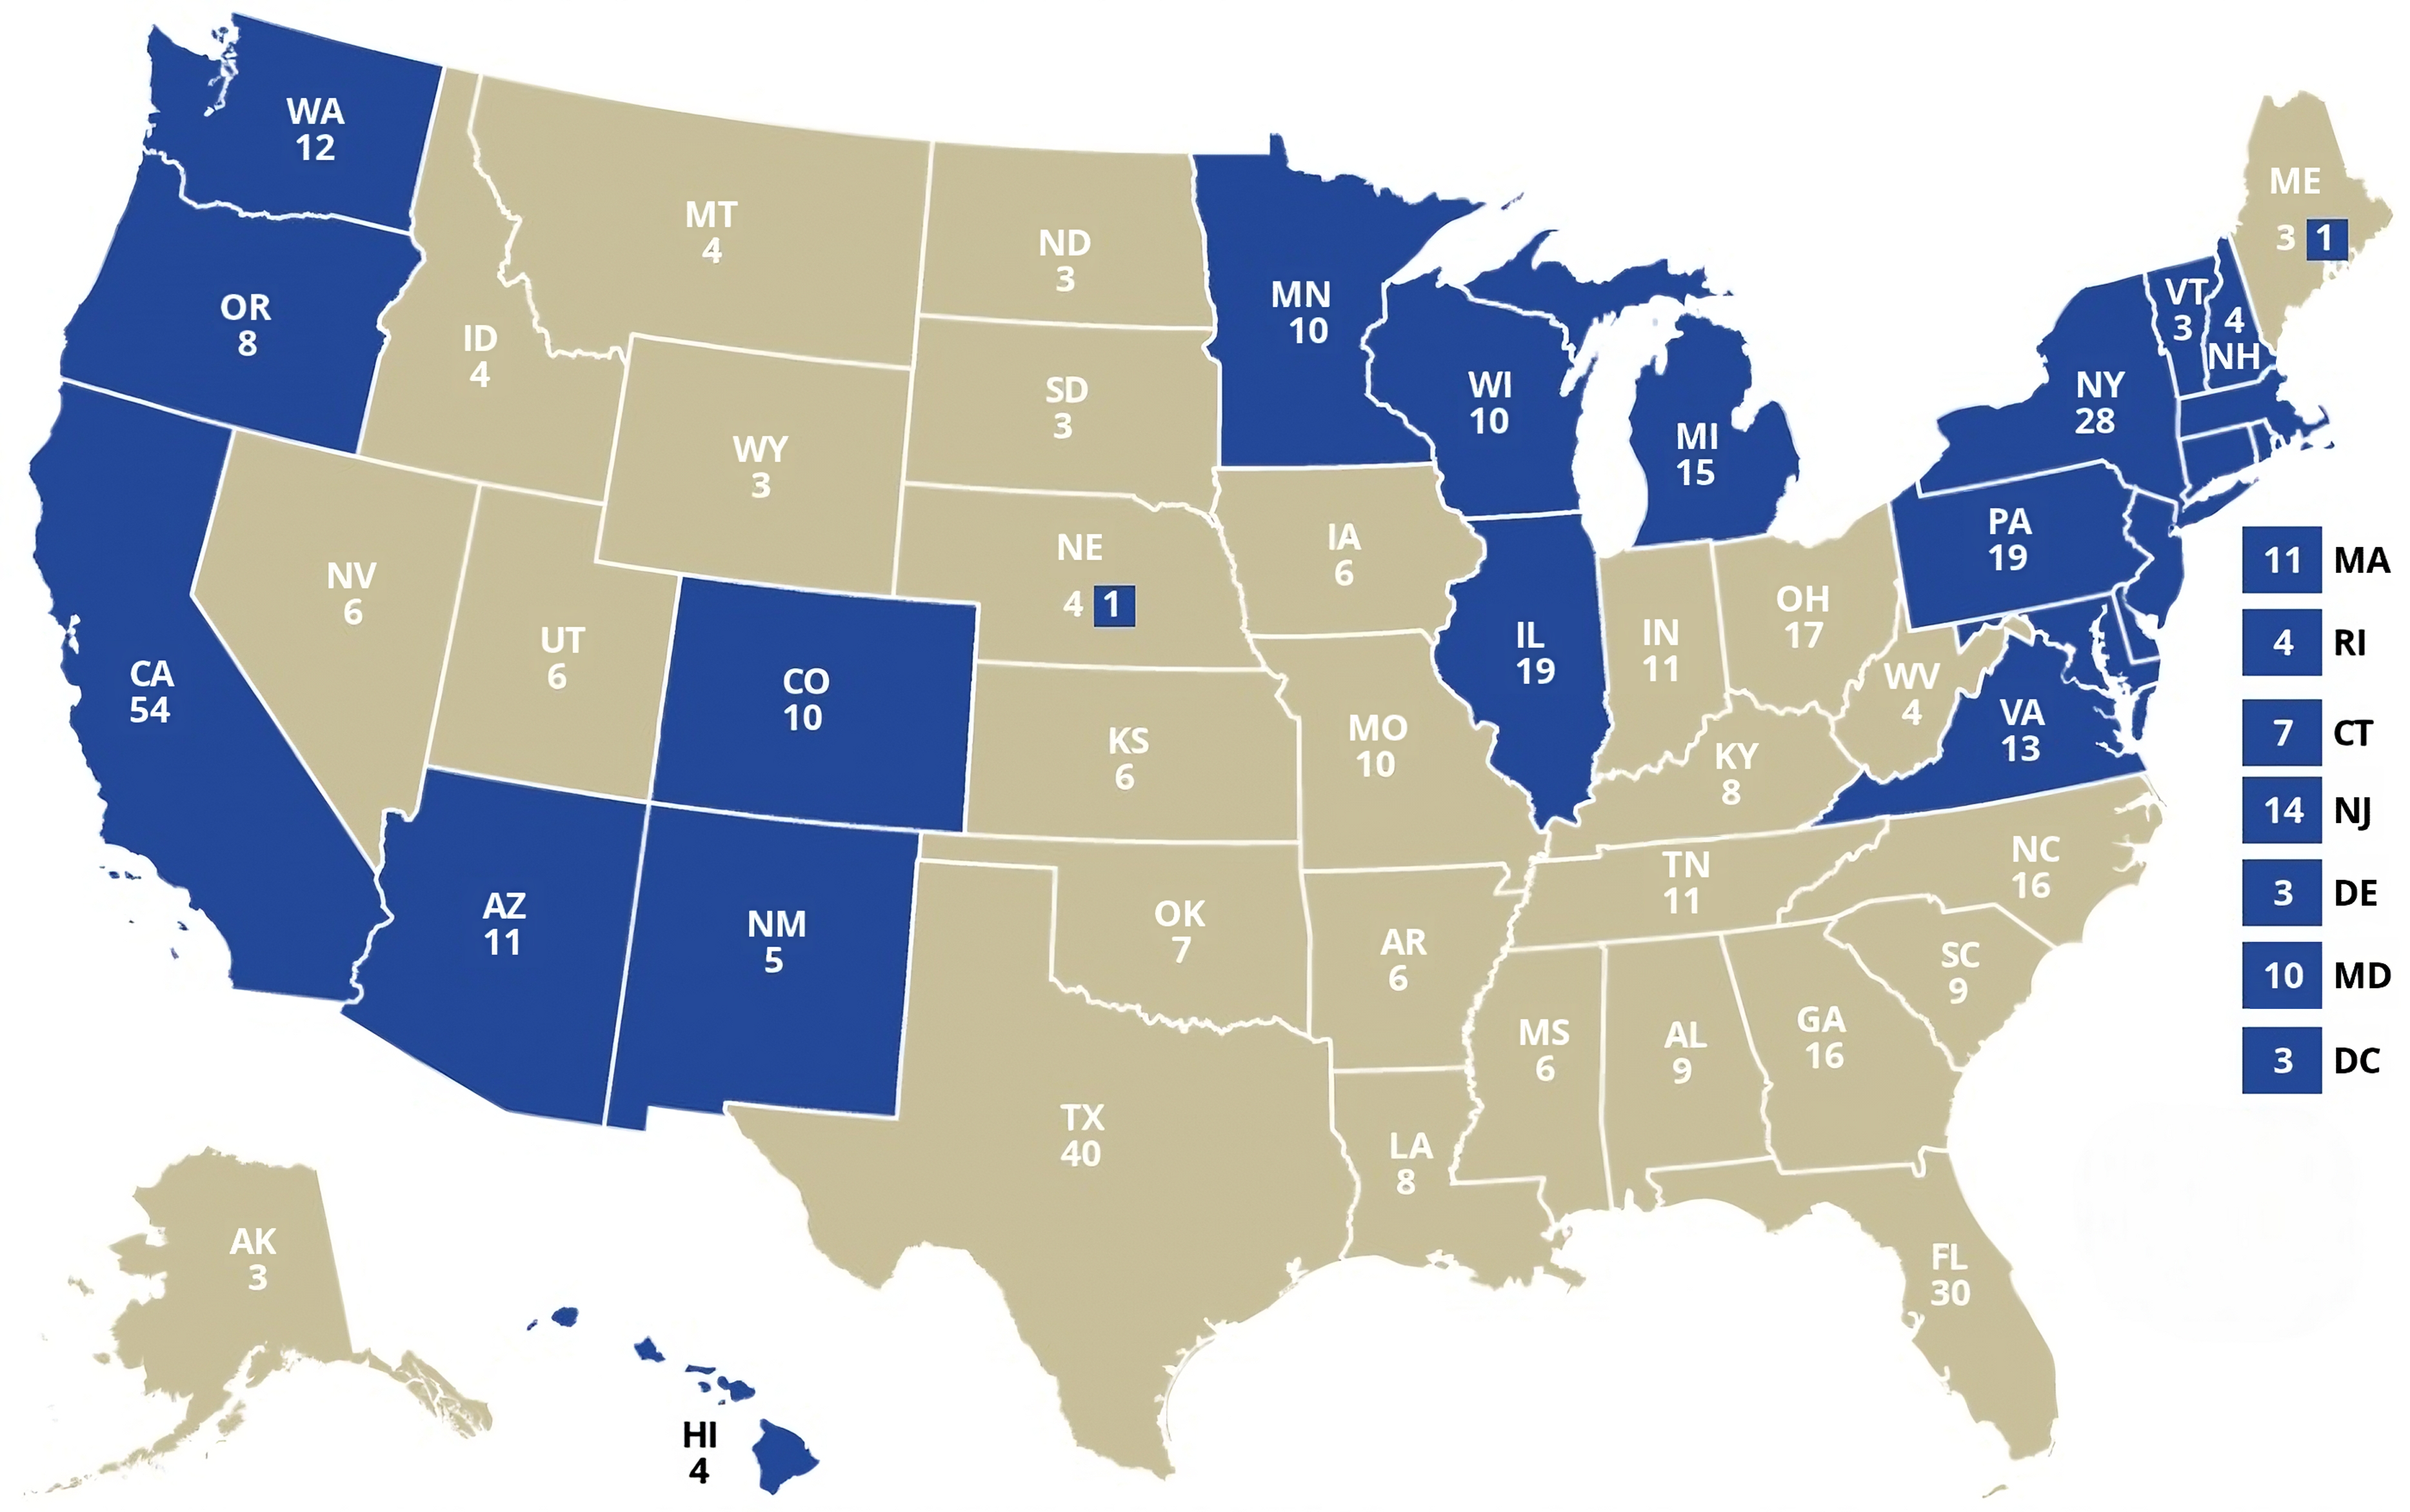
Biden's easiest map
Biden's most likely path to 270 electoral votes and the presidency.

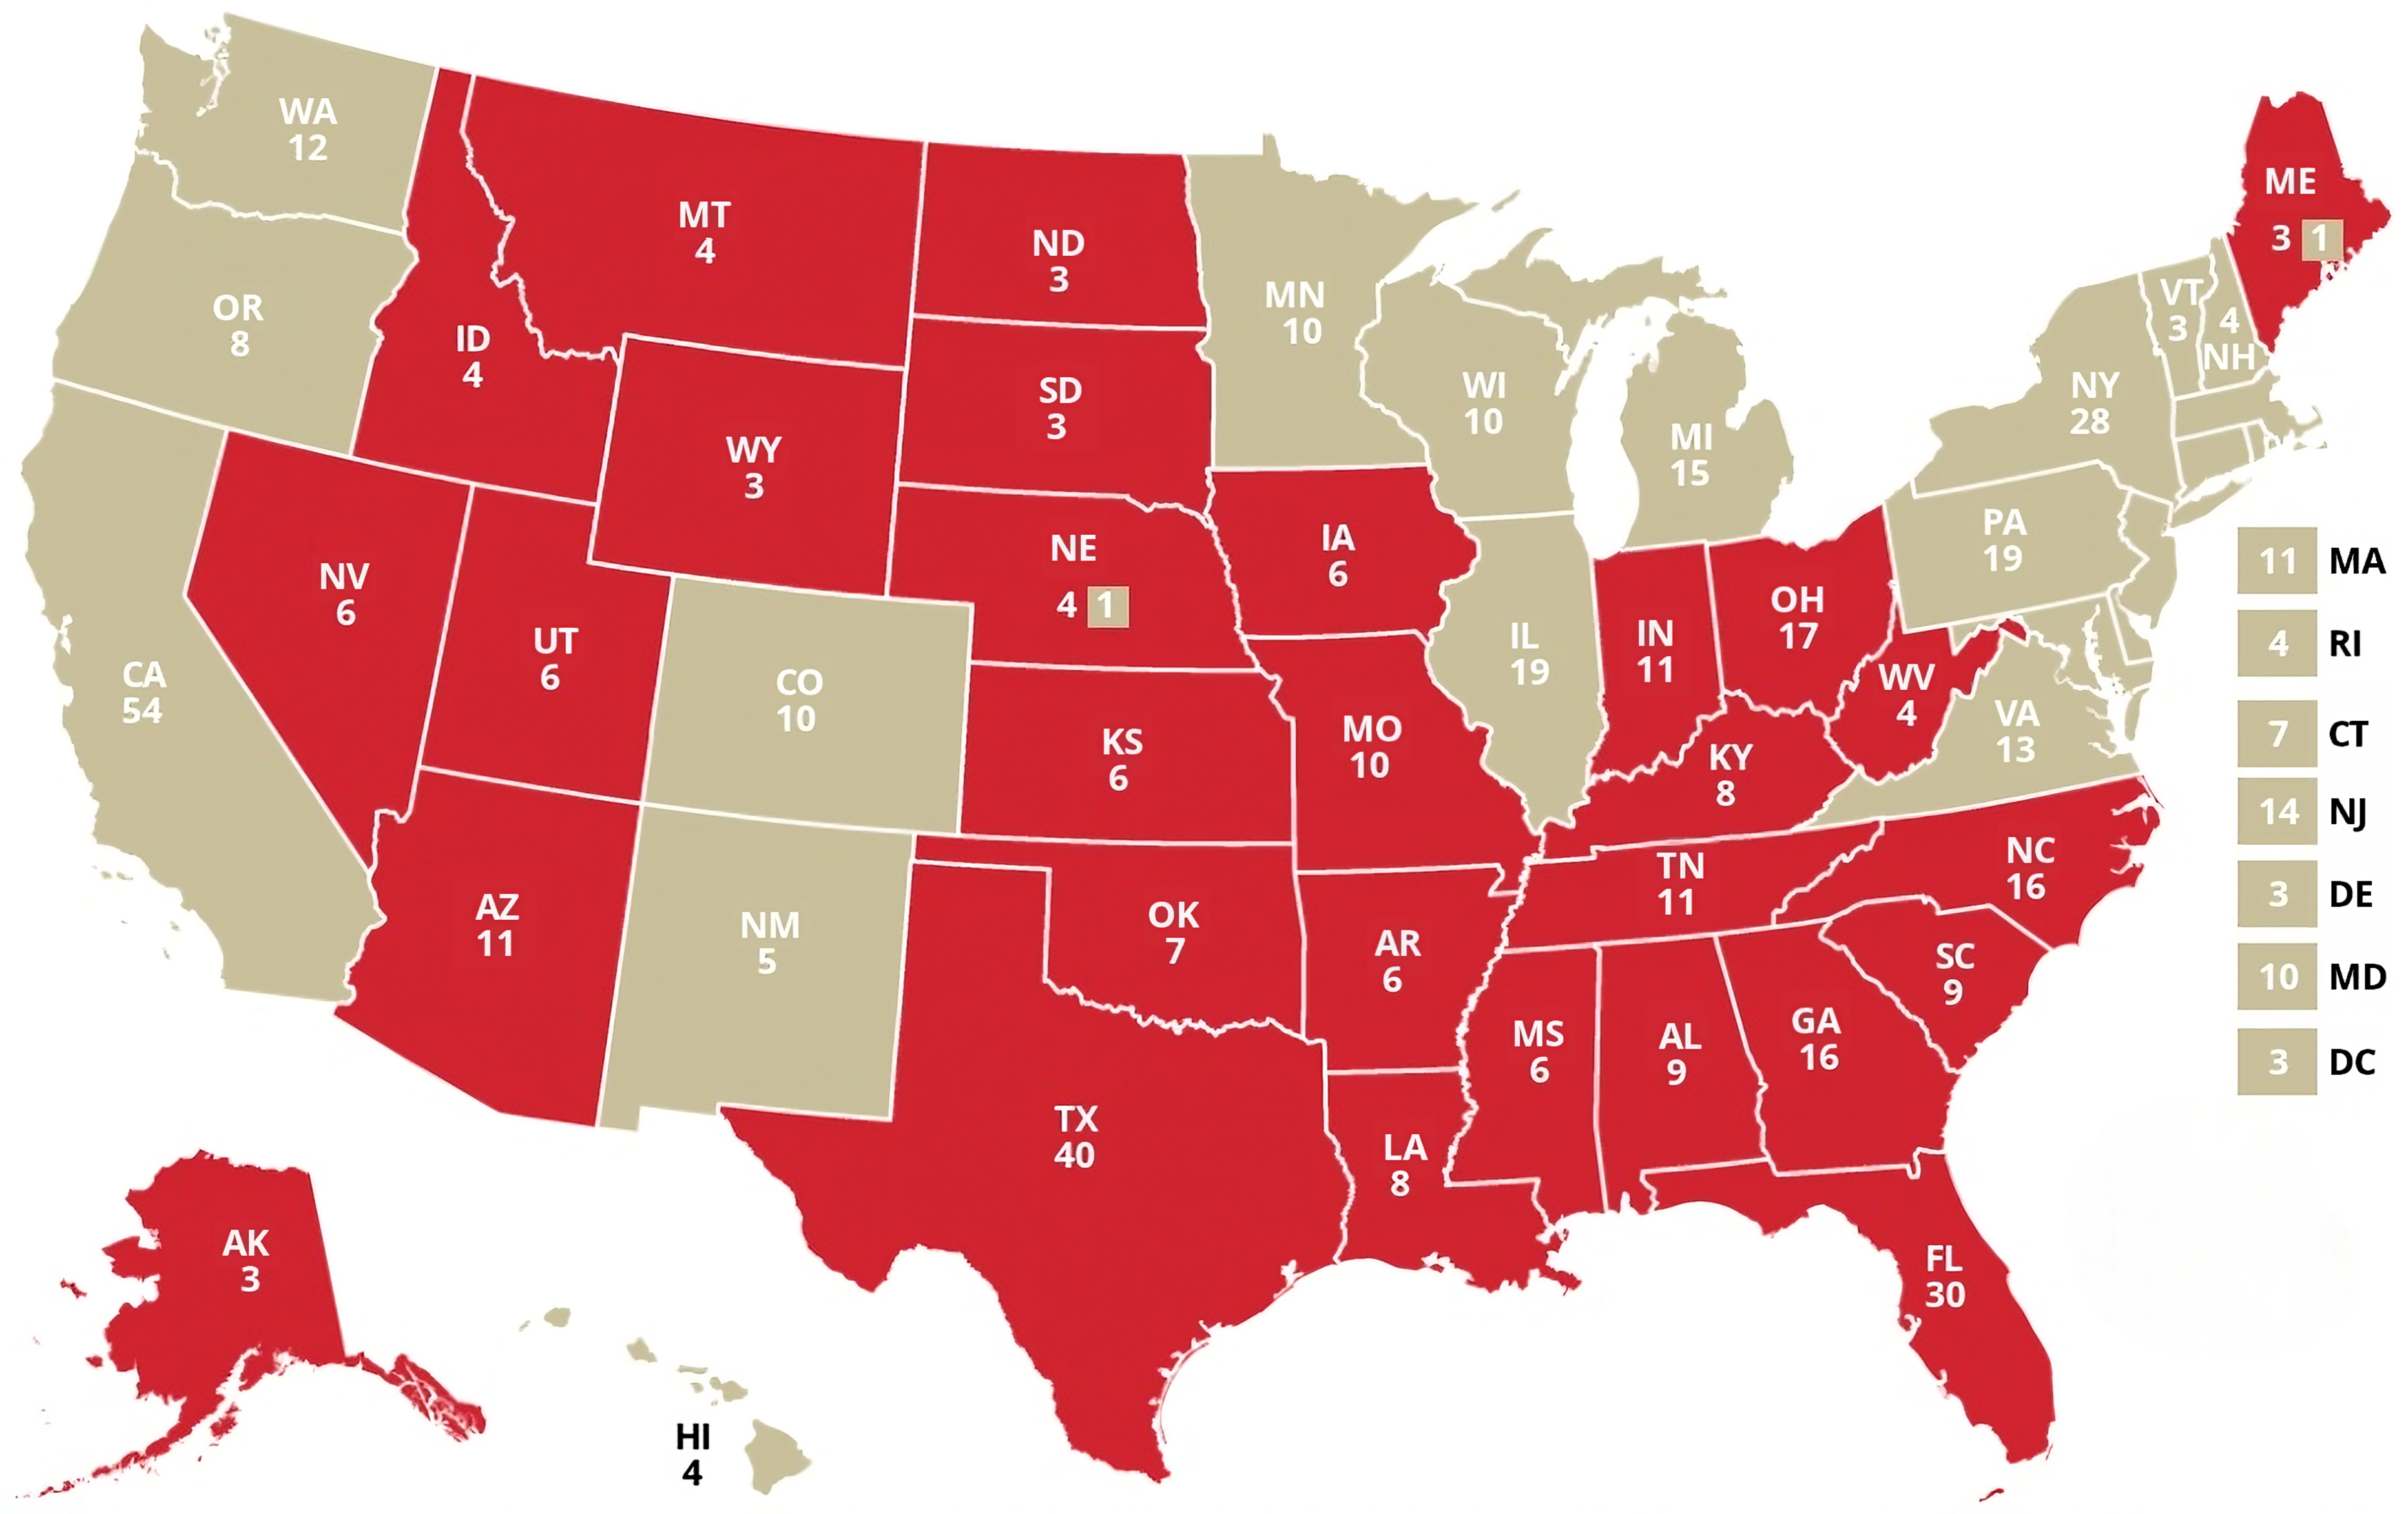
Trump's easiest map
Trump's most likely path to 270 electoral votes and the presidency.
